General
Recorded bus traffic can be analyzed inside a trace window. A recording is always required to display data. Both messages as well as the associated signal values can be monitored. To view the corresponding signal values, expand the message by clicking on the plus sign in the first column. A new trace window can be created via the context menu in the tree view.
Set filters
A fresh trace window or a trace window to which no messages are assigned, displays all messages. Interesting messages can be assigned to the trace window using drag & drop editing. If the complete bus is dragged on a trace window, for example, all messages of this bus are displayed. All filtered objects (busses, control units, messages or signals) are displayed in the tree view below the corresponding trace window.
Pass filter example
Requirement |
A certain message of a control unit should be displayed and analysed in a trace window. |
Action |
Look up the message to be analysed with the search function. User Drag&Drop to move this message on the core application trace panel. |
Result |
 Pass filter for a message and two signals A new trace windows opens which displays the selected message (if this message is already available in the current recording). Below the new trace window the selected message is displayed in the tree view. |

Example for a pass filter: This trace window monitors all messages of the ABS control unit.
In the list below all messages which are not recorded yet are listed.
Columns of the trace window
In the following, the column content of the trace window is described. The data could be sorted by clicking on the column heading in the mode "Show last received message only". The sorting of the data is shown by arrows beside the heading.
You can use the context menu to add/remove columns.
Column |
Description |
1st column (unlabeled) |
Known messages could be opened/closed by clicking on the icons "+" and "-" (signals inside the message will be shown, when opened). |
Timestamp |
The timestamps shows, when a message was received or transmitted. The time is displayed in seconds, the resolution is 1 millisecond. Based on the current mode, the absolute time of a received/transmitted message or the relative time to the previous message is displayed. |
C |
Displays the configured display channel. |
Identifier |
CAN-ID of the message. |
Name |
Name of the message at known messages. If a message is unknown "UNKNOWN" is displayed. Marker, error frames and chip states are also displayed in this column (see graphic below this table). |
Dir |
Entries in this column defines, if the messages is a transmitted or received message: |
D |
Number of data bytes inside the message (DLC) |
Data |
Content/data bytes of the message (left byte = low byte) |
Channel |
Name of the bus on which the messages was received. |
Contents of the trace window
Beside messages defined through the database and configured filters, also other informations like error frames, unkown messages, chip states and markers could be displayed in the trace window. The named informations could be display via the corresponding buttons in the toolbar of the trace window.
Arrangement of the trace window
The positions of the columns inside the table could arranged by drag&drop the column header to the corresponding position. The width of the columns could be changed by moving the right margin of each column with the mouse. A double click on the margin fits the width to the widest colums entry.
Representation of chronological sequence
Signals or messages can be monitored in updating form or continuously (chronological sequence). The views can be switched using the buttons Show last received messages only and Display all.
•Continuous
All messages are listed in the sequence in which they were received.
•Updated
For each individual message, only the most recently received message is displayed.
Display of not yet recorded messages
Optionally, all messages which were not received until a certain time can be listed in the bottom field. As soon as a message is received, it is removed from this list. This list can be toggled on and off; via the icon Display not recorded messages.
Export of data out of the trace window
With the export function the (filtered) data displayed in the trace window could be exported into several file formats or to the clipboard. So it is possible to filter defined data out of the recording and reuse it in different data formats.
The needed data/messages must be selected with the mouse cursor or by the context menu ("Select all") in the trace window. It is also possible to mark messages selective (Ctrl and left mouse key -> mark single messages, Shift and left mouse key -> mark range between two messages). If necessary, the update of the trace window or the simulation must be stopped before selecting the data. The selected data could now be exported via the context menu into a file or into the clipboard with several formats.
File formats
Format |
Description |
*.txt |
The data will be stored as a text file. The data is stored as it is displayed in the table of the trace window. Every line is terminated with a CR/LF. |
*.csv |
The data will be stored as a CSV file (separated by semicolon). The following data/columns will be exported (header of the CSV file) Time; BusId; MsgId; MsgName; Dir; Dlc; Data; BusName; |
*.asc |
The data will be stored as ASC file. |
*.celog |
The data will be stored as CanEasy compressed recording format. |
Text formats for exporting data to the clipboard
Format |
Description |
Copy as text |
The data will be copied as simple text. The data is transferred as it is displayed in the table of the trace window. Between the data values spaces are fit in. Every line is terminated with a CR/LF. |
Copy as table |
The data will be copied as simple text. The data is transferred as it is displayed in the table of the trace window. Between the data values tabulators are fit in. Every line is terminated with a CR/LF. (use this format e.g. to transfer the data direcly into an excel sheet) |
Copy as ASC |
The data is copied as ASC format. |
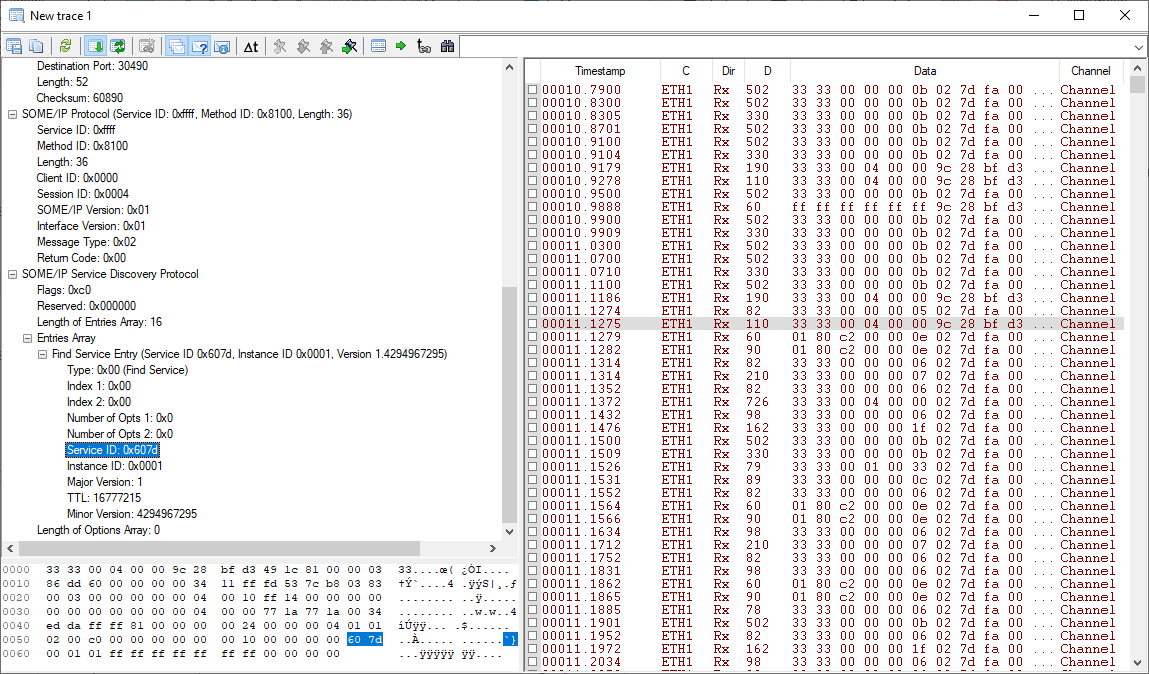
Display of protocols in the Details window
The Details window displays additional information for the selected entry in the Trace Window.
Protocols e.g. UDP or SOME/IP are displayed interpreted.
If a database reference exists the information is used to map the payload to physical values.
For the interpretation of the protocols individual parameters can be selected.
In this case the data view section highlights the selected parameter.
You can also select a range in the data section to highlight the corresponding parameter.
By default the Details window is not shown.
To show it, click on the following icon in the toolbar: ![]()
In the opened context menu select "Show Details window".
To hide the window, repeat the same steps.
The context menu of the Details window allows you to expand or collapse all entries.
It is also possible to copy the content to the clipboard.