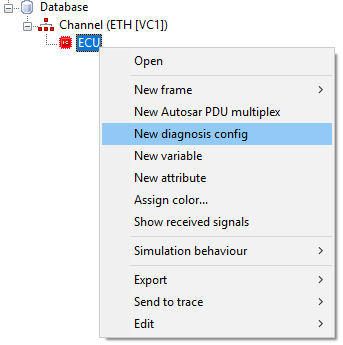
To use diagnostic services via Ethernet (DoIP), an Ethernet channel must first be created below the database.
Next an ECU must be created below the channel.
The ECU then allows the creation of a diagnostic configuration.
Since each ECU has its own configuration, it is possible to diagnose several ECUs at the same time.

Diagnosis configuration |
|
Version |
The DoIP Spec version to be used. |
NetworkCardIPType |
The IP address version to be used (IPv4, IPv6). |
SourceIP |
This parameter is optional. If more than one network card is used, the IP address from which to send should be entered here. |
DestIP |
IP address of the ECU to be diagnosed. This is automatically sent via the Ethernet adapter that matches this IP. (Can be set via the VIN dialog). |
SA |
It may be that an ECU only allows a certain source address. |
TA |
The target address of the ECU to be diagnosed. (Can be set via the VIN dialog.) |
Vehicle Information (VIN):
If the IP address and TA of the ECU is already known, the next steps can be skipped.
The "Vehicle Information (VIN)" window can be opened via the context menu of the DoIP configuration.
The default settings are the NetworkCardIPType and the SourceIP from the DoIP configuration.
Each ECU should listen to the multicast address (for IPv6) or broadcast address (for IPv4) and respond to a VIN request.
When clicking the "Send" button, the responses of all ECUs connected to the network will be listed.
After selecting the ECU to be diagnosed, the IP address and TA will be automatically taken.
If the ECU does not respond to the multicast address, another IP address can be entered.
Filtering the VIN:
The VIN request can be used to filter which ECUs respond.
EID Filter: 6 byte value containing the MAC address.
VIN Filter: ASCII string with a maximum of 17 characters.
Info:
VIN communication runs over UDP port 13400 and can be used even when the simulation is stopped.
The DoIP communication runs over TCP port 13400.
When starting the simulation, or at the latest when sending a service, an attempt is made to establish a connection with the target.
If this fails, a corresponding error message is displayed in the report window.